
|
| Our reACT house simulation system runs automatically once a day in the early morning hours after hourly outdoor air temperature and cloud cover forecasts are downloaded from weather prediction websites corresponding to the location of each house. With the day's weather information in hand, the simulator predicts each house's expected performance over the day using the following simulation element modules: |
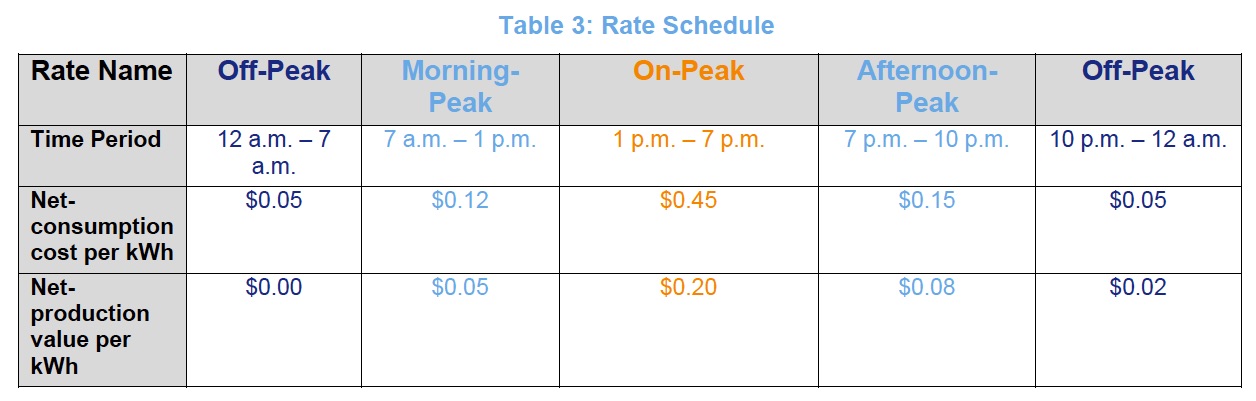
| The need to model net electrical power production/consumption as a function of time of day is made clear by the rate schedule set by the 2017 Solar Decathlon organizers. In this schedule, we see the differences between consumption cost and production value during five different periods during the day, contributing to the large jumps in instantaneous profit/costs predicted by our economic simulator. |
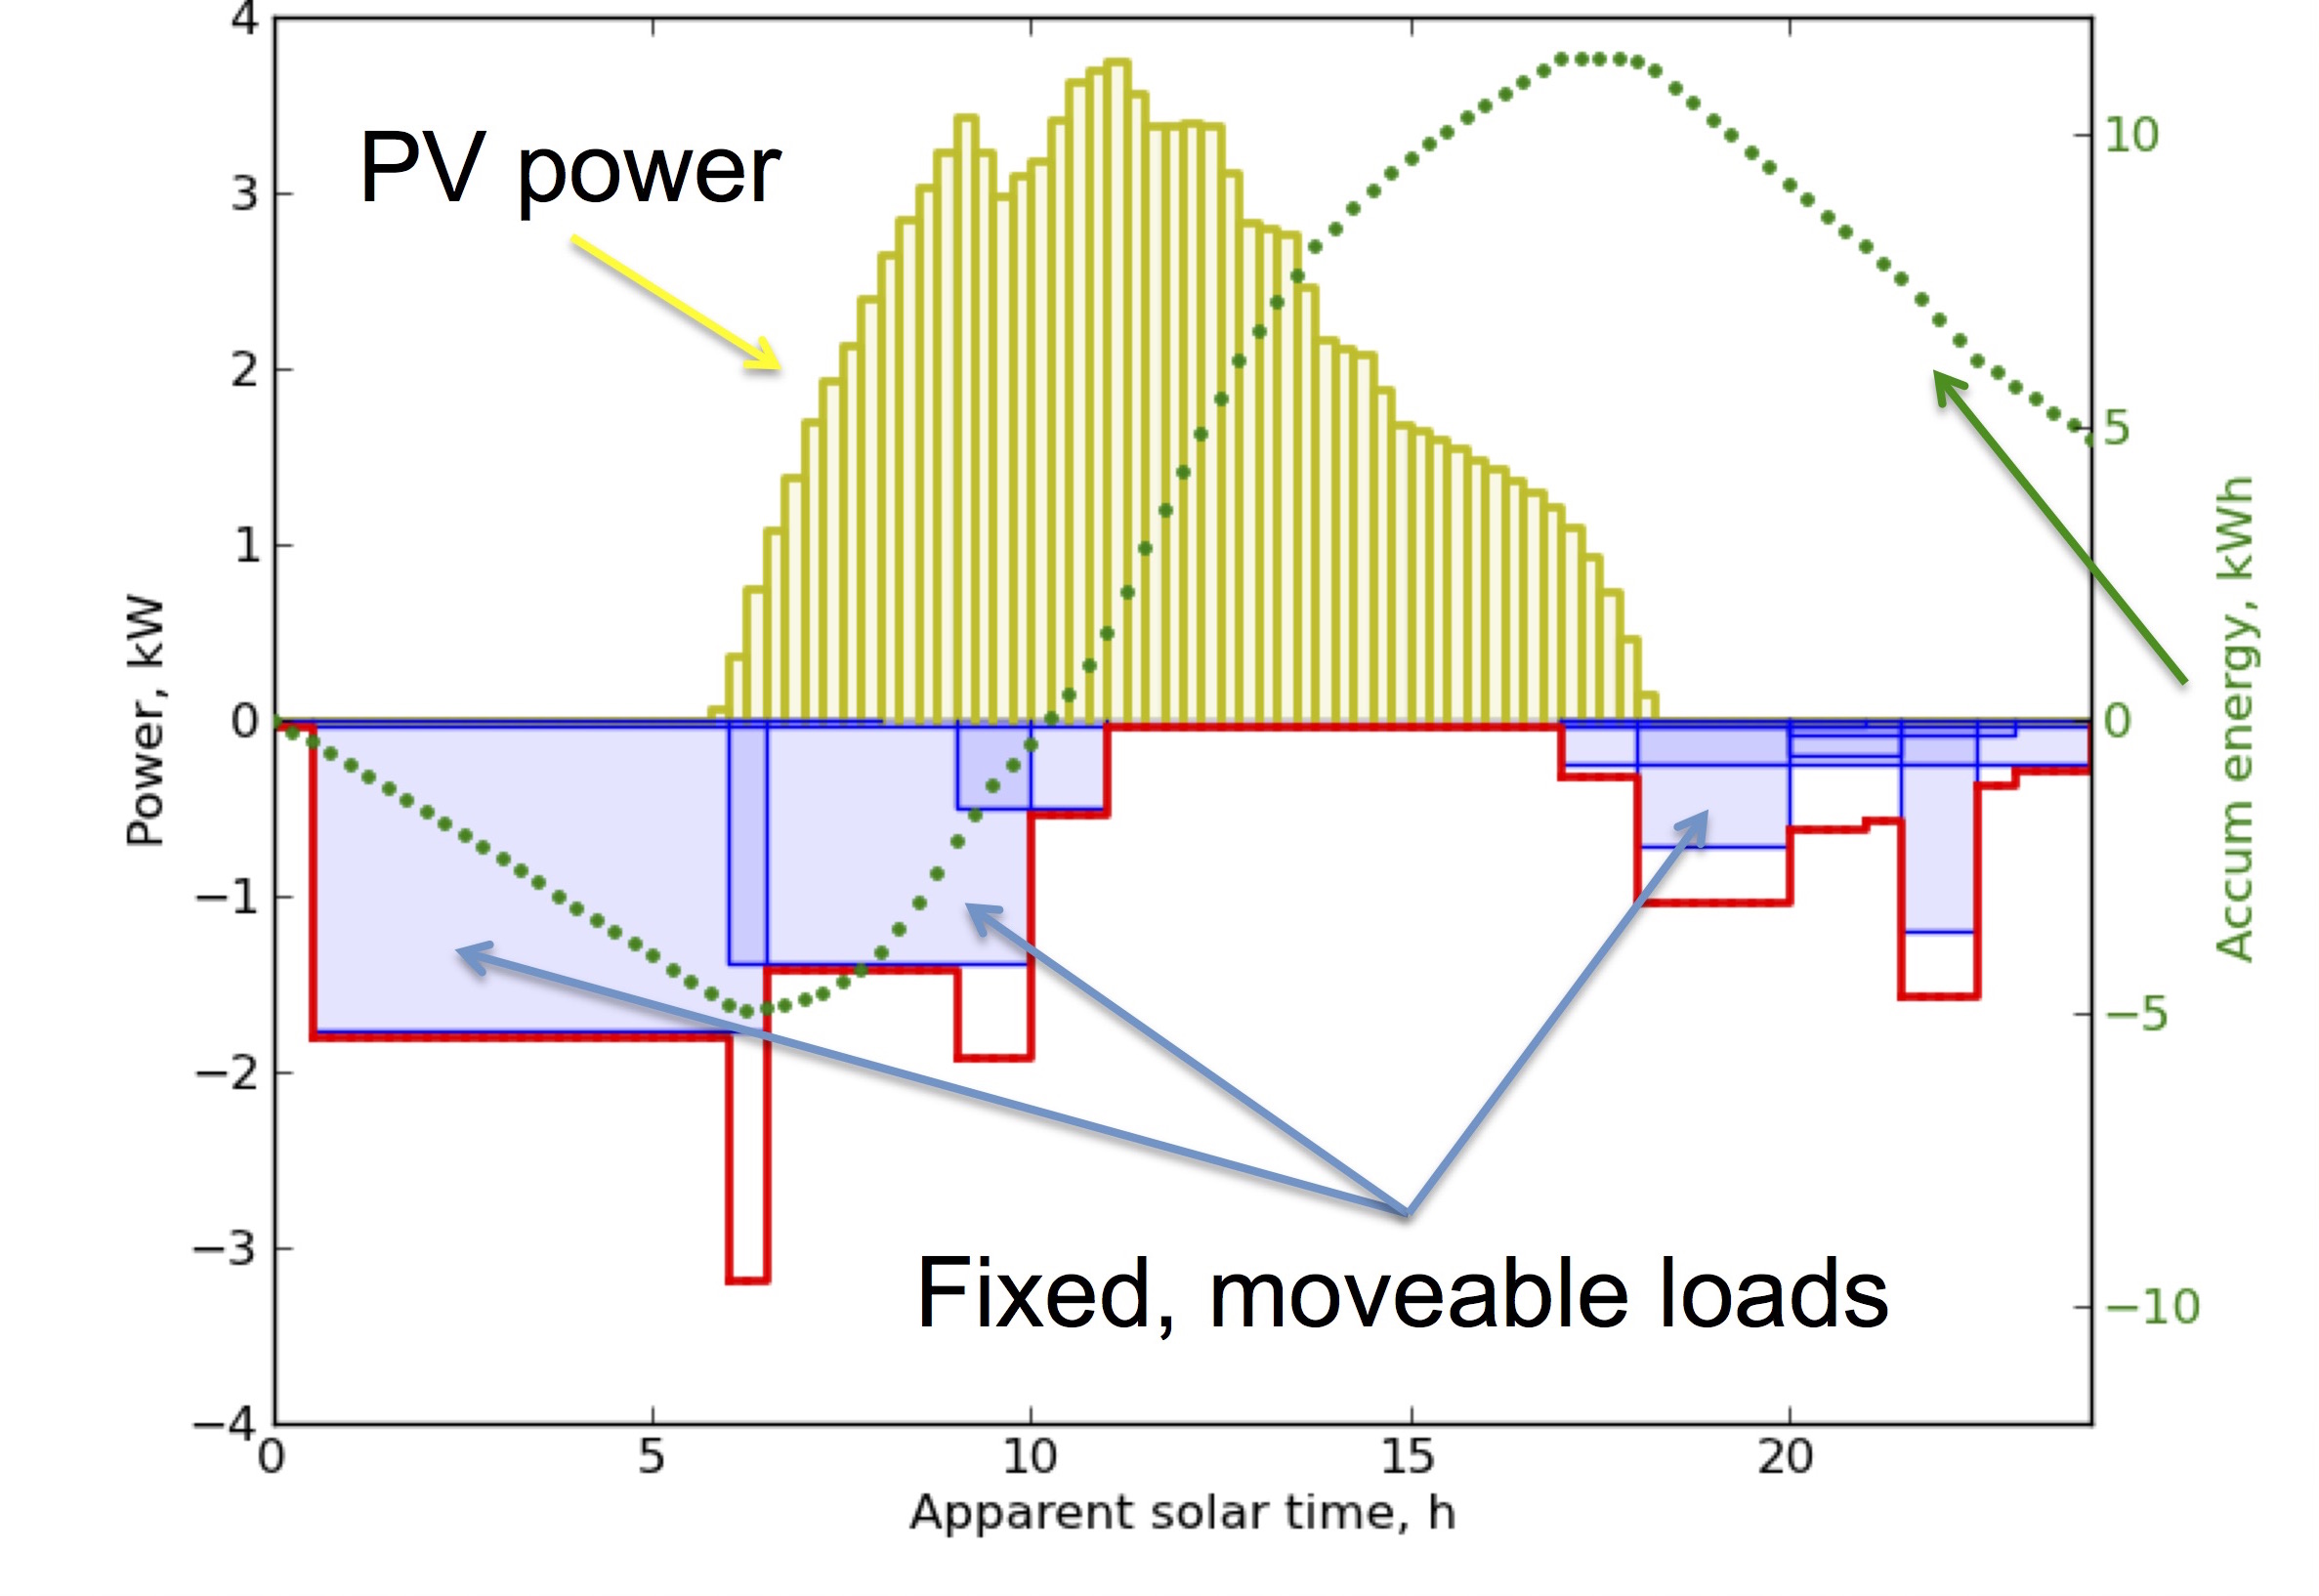
| Predicted electrical power produced by the PV system is represented by positive values and is denoted in yellow; total power used due to scheduled events correspond to negative values and are shown in red; net energy production for the day is shown in green. |
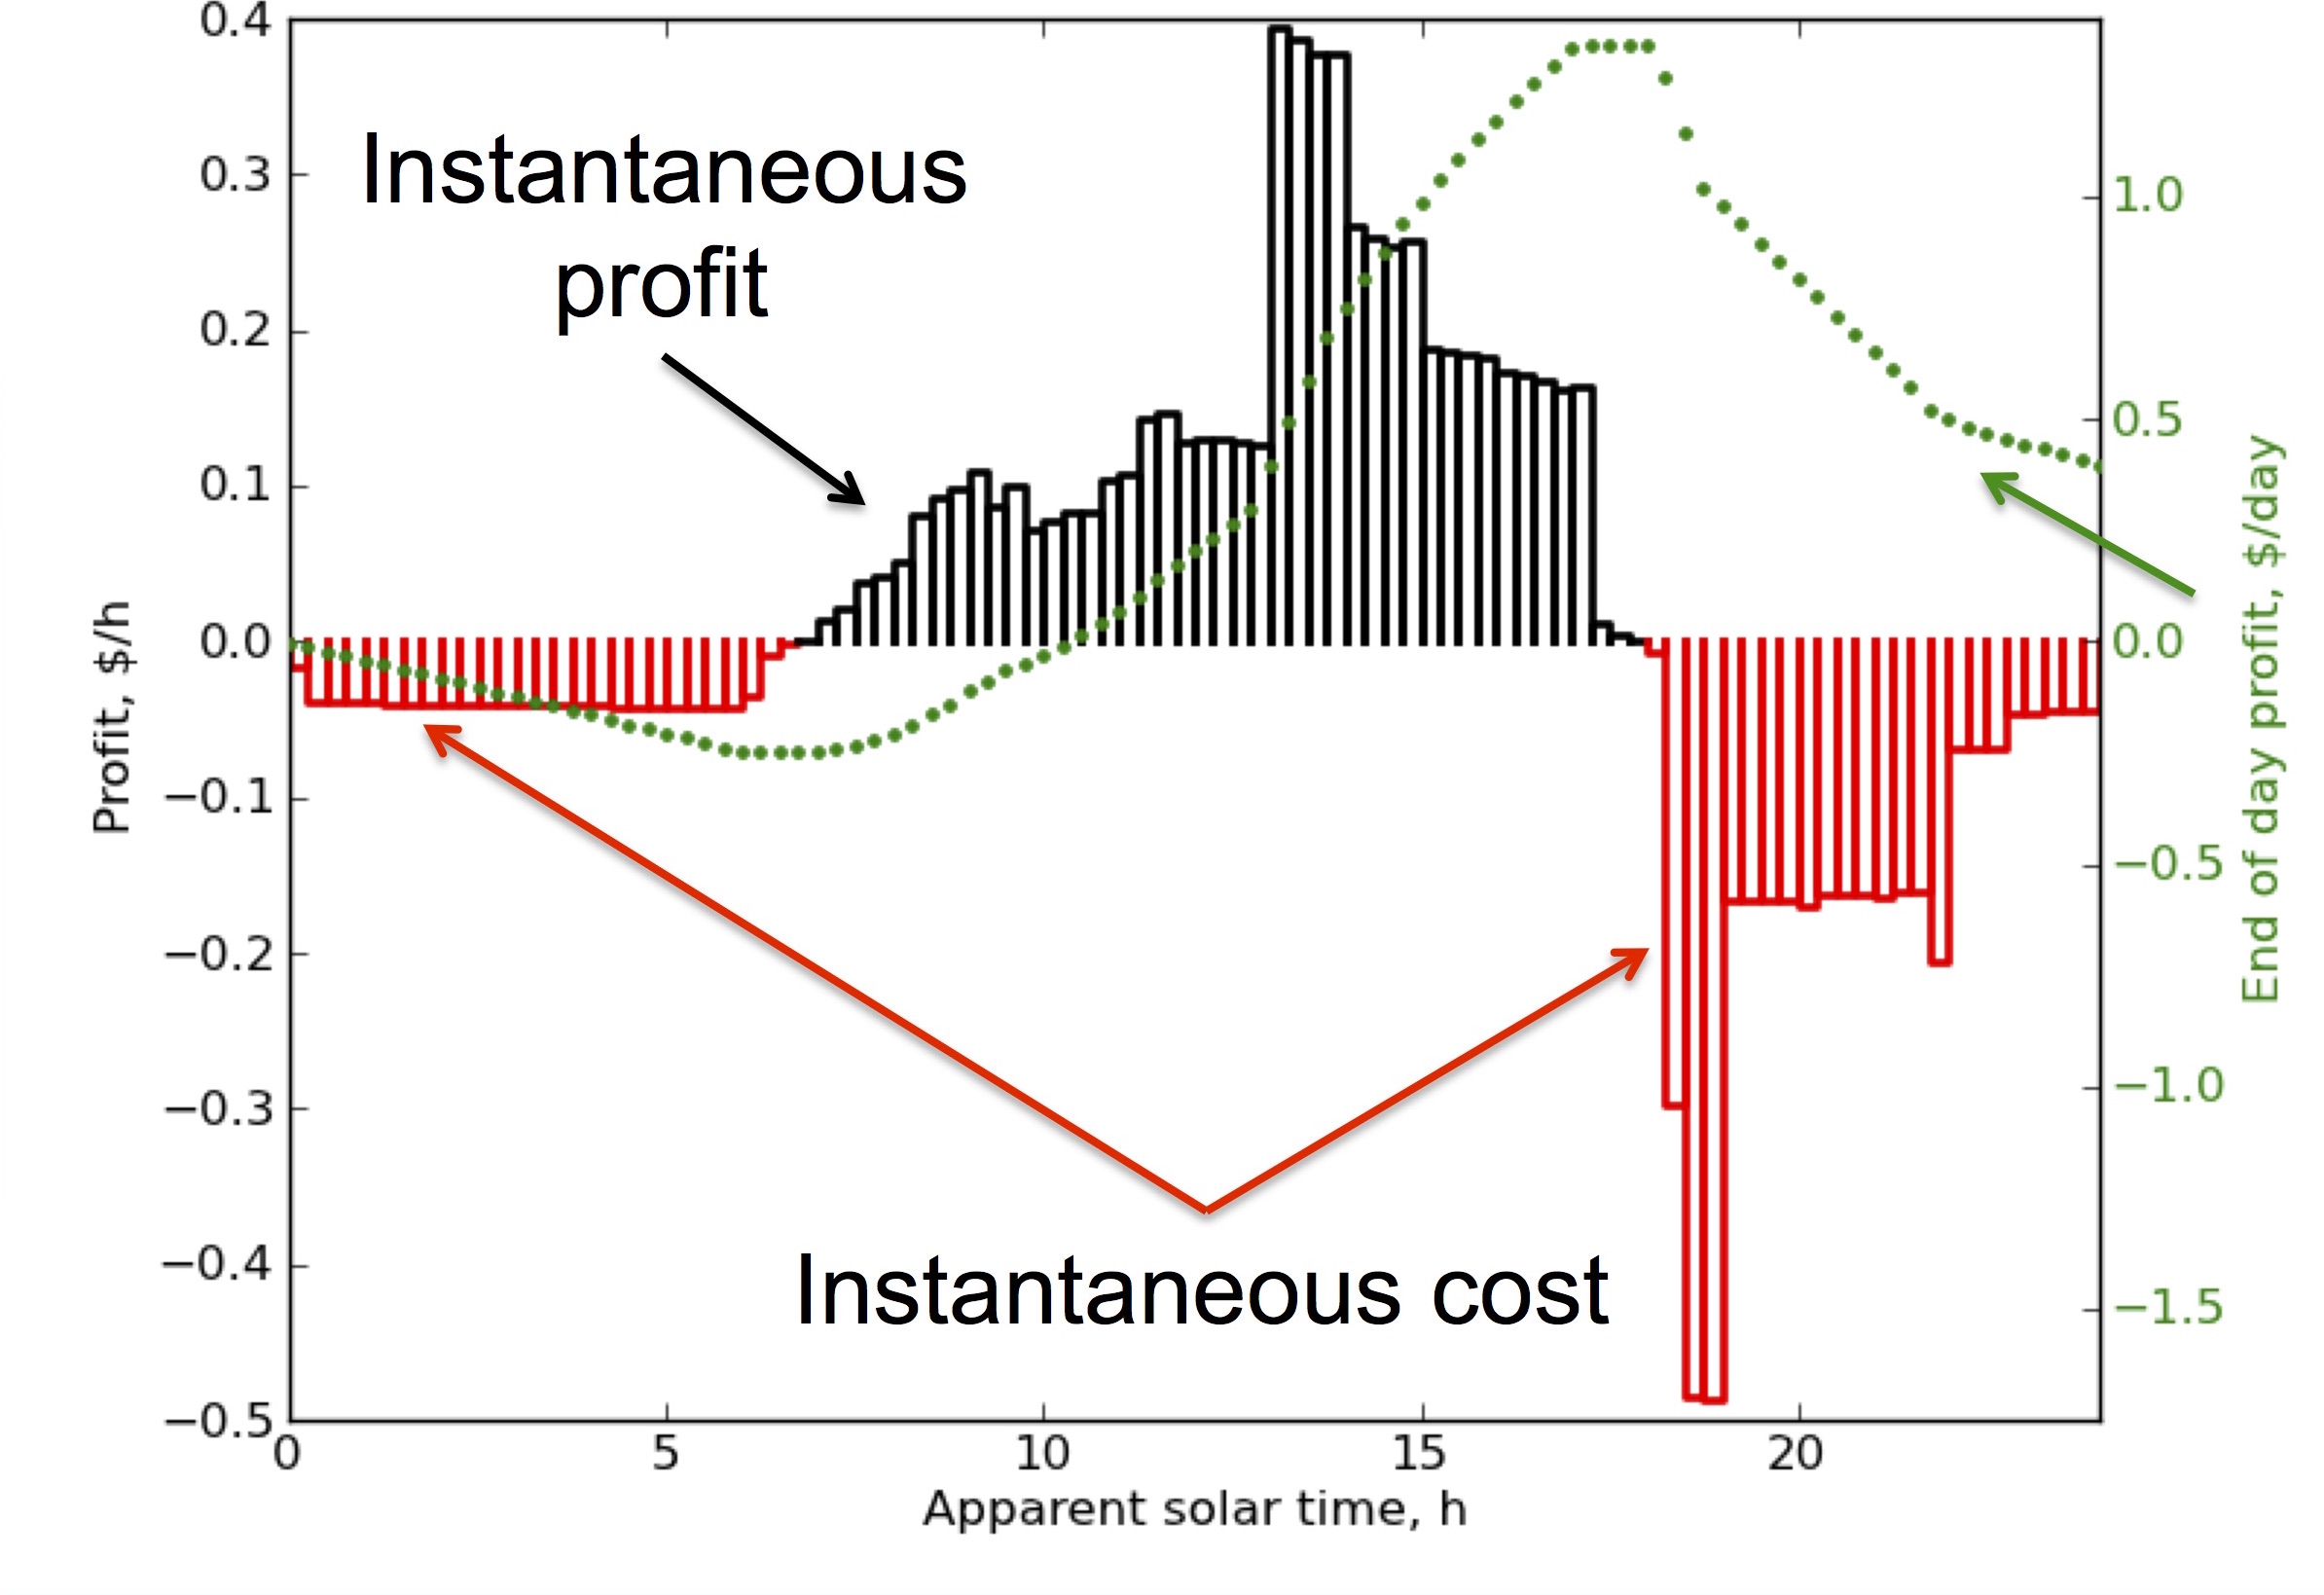
| Instantaneous profit (black) and costs (red), with accumulated profit shown in green. |
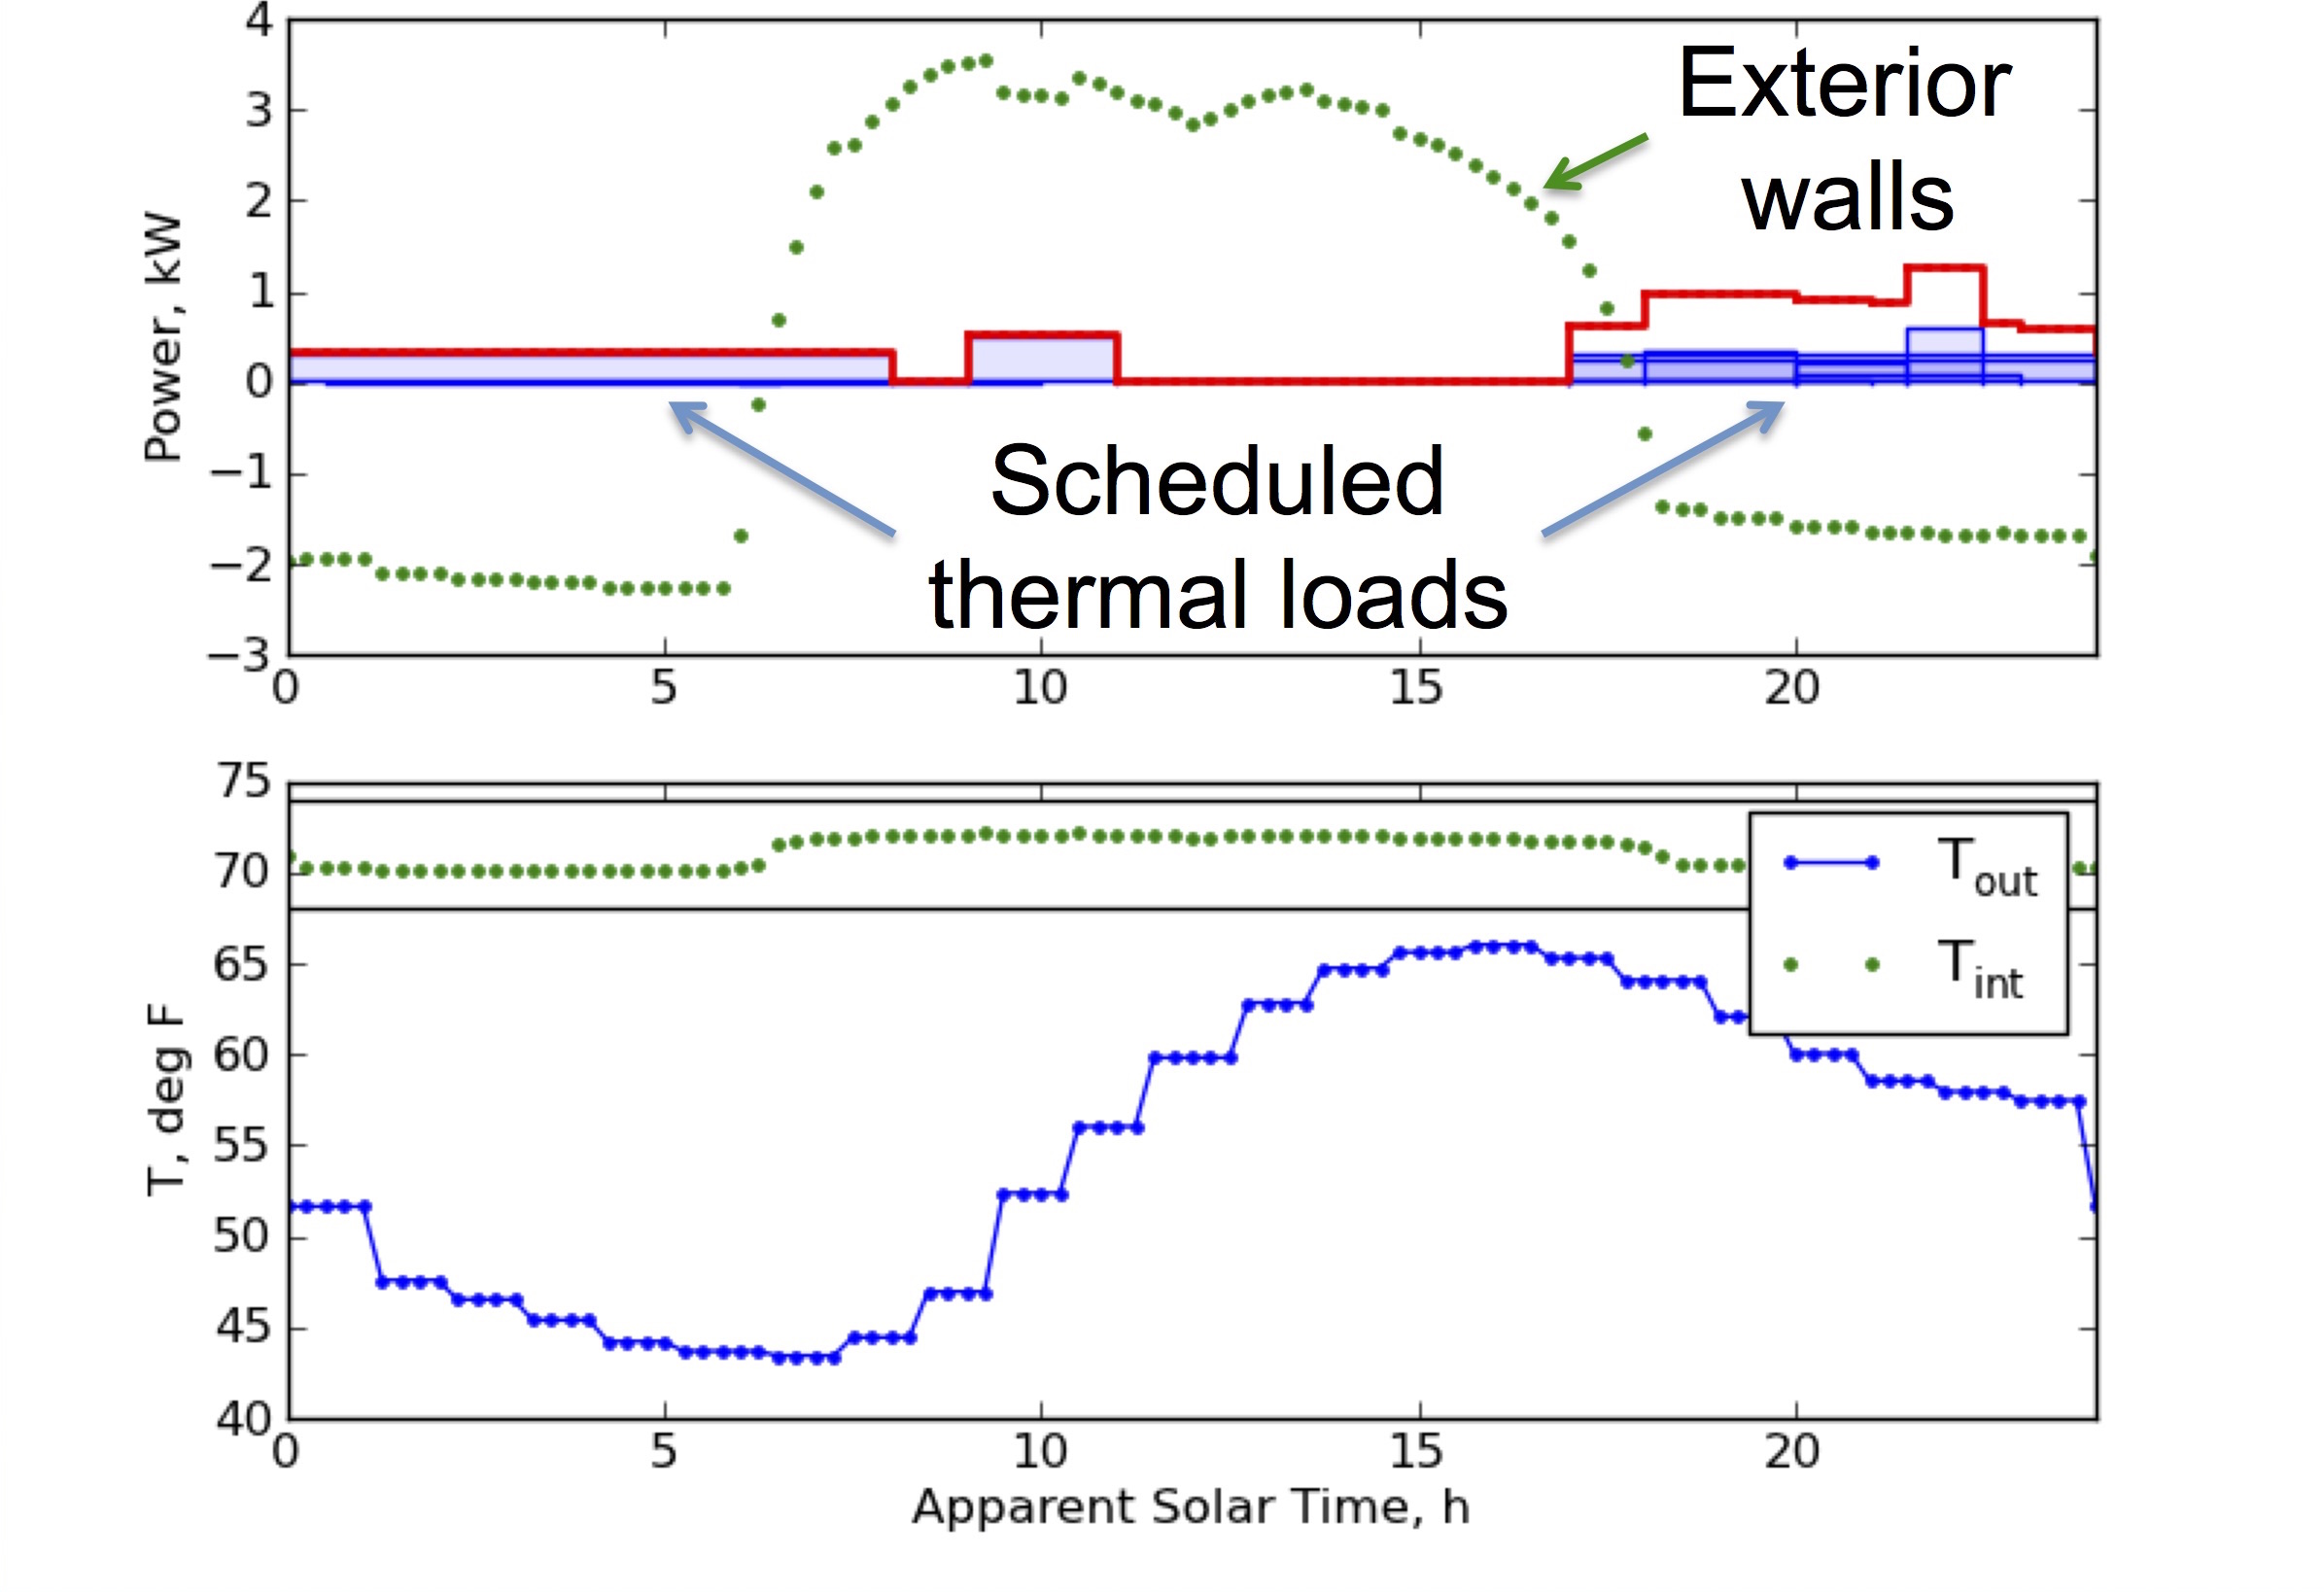
| Top: house thermal load due to scheduled events (red) and due to heat transfer with the environment (green). Bottom: outdoor/indoor temperatures shown as blue/green. |
For more information contact www.thinfilm.umd.edu